🎯 The Question
We found that all stocks have terrible price efficiency — less than 10% for most. But what if that's just because we were looking at monthly bars?
What happens when we change the bar size?
📊 Tencent (0700): The Timeframe Experiment
Using daily data (5,639 bars) for Tencent from 2015-2026, we aggregated into different bar sizes and measured efficiency.
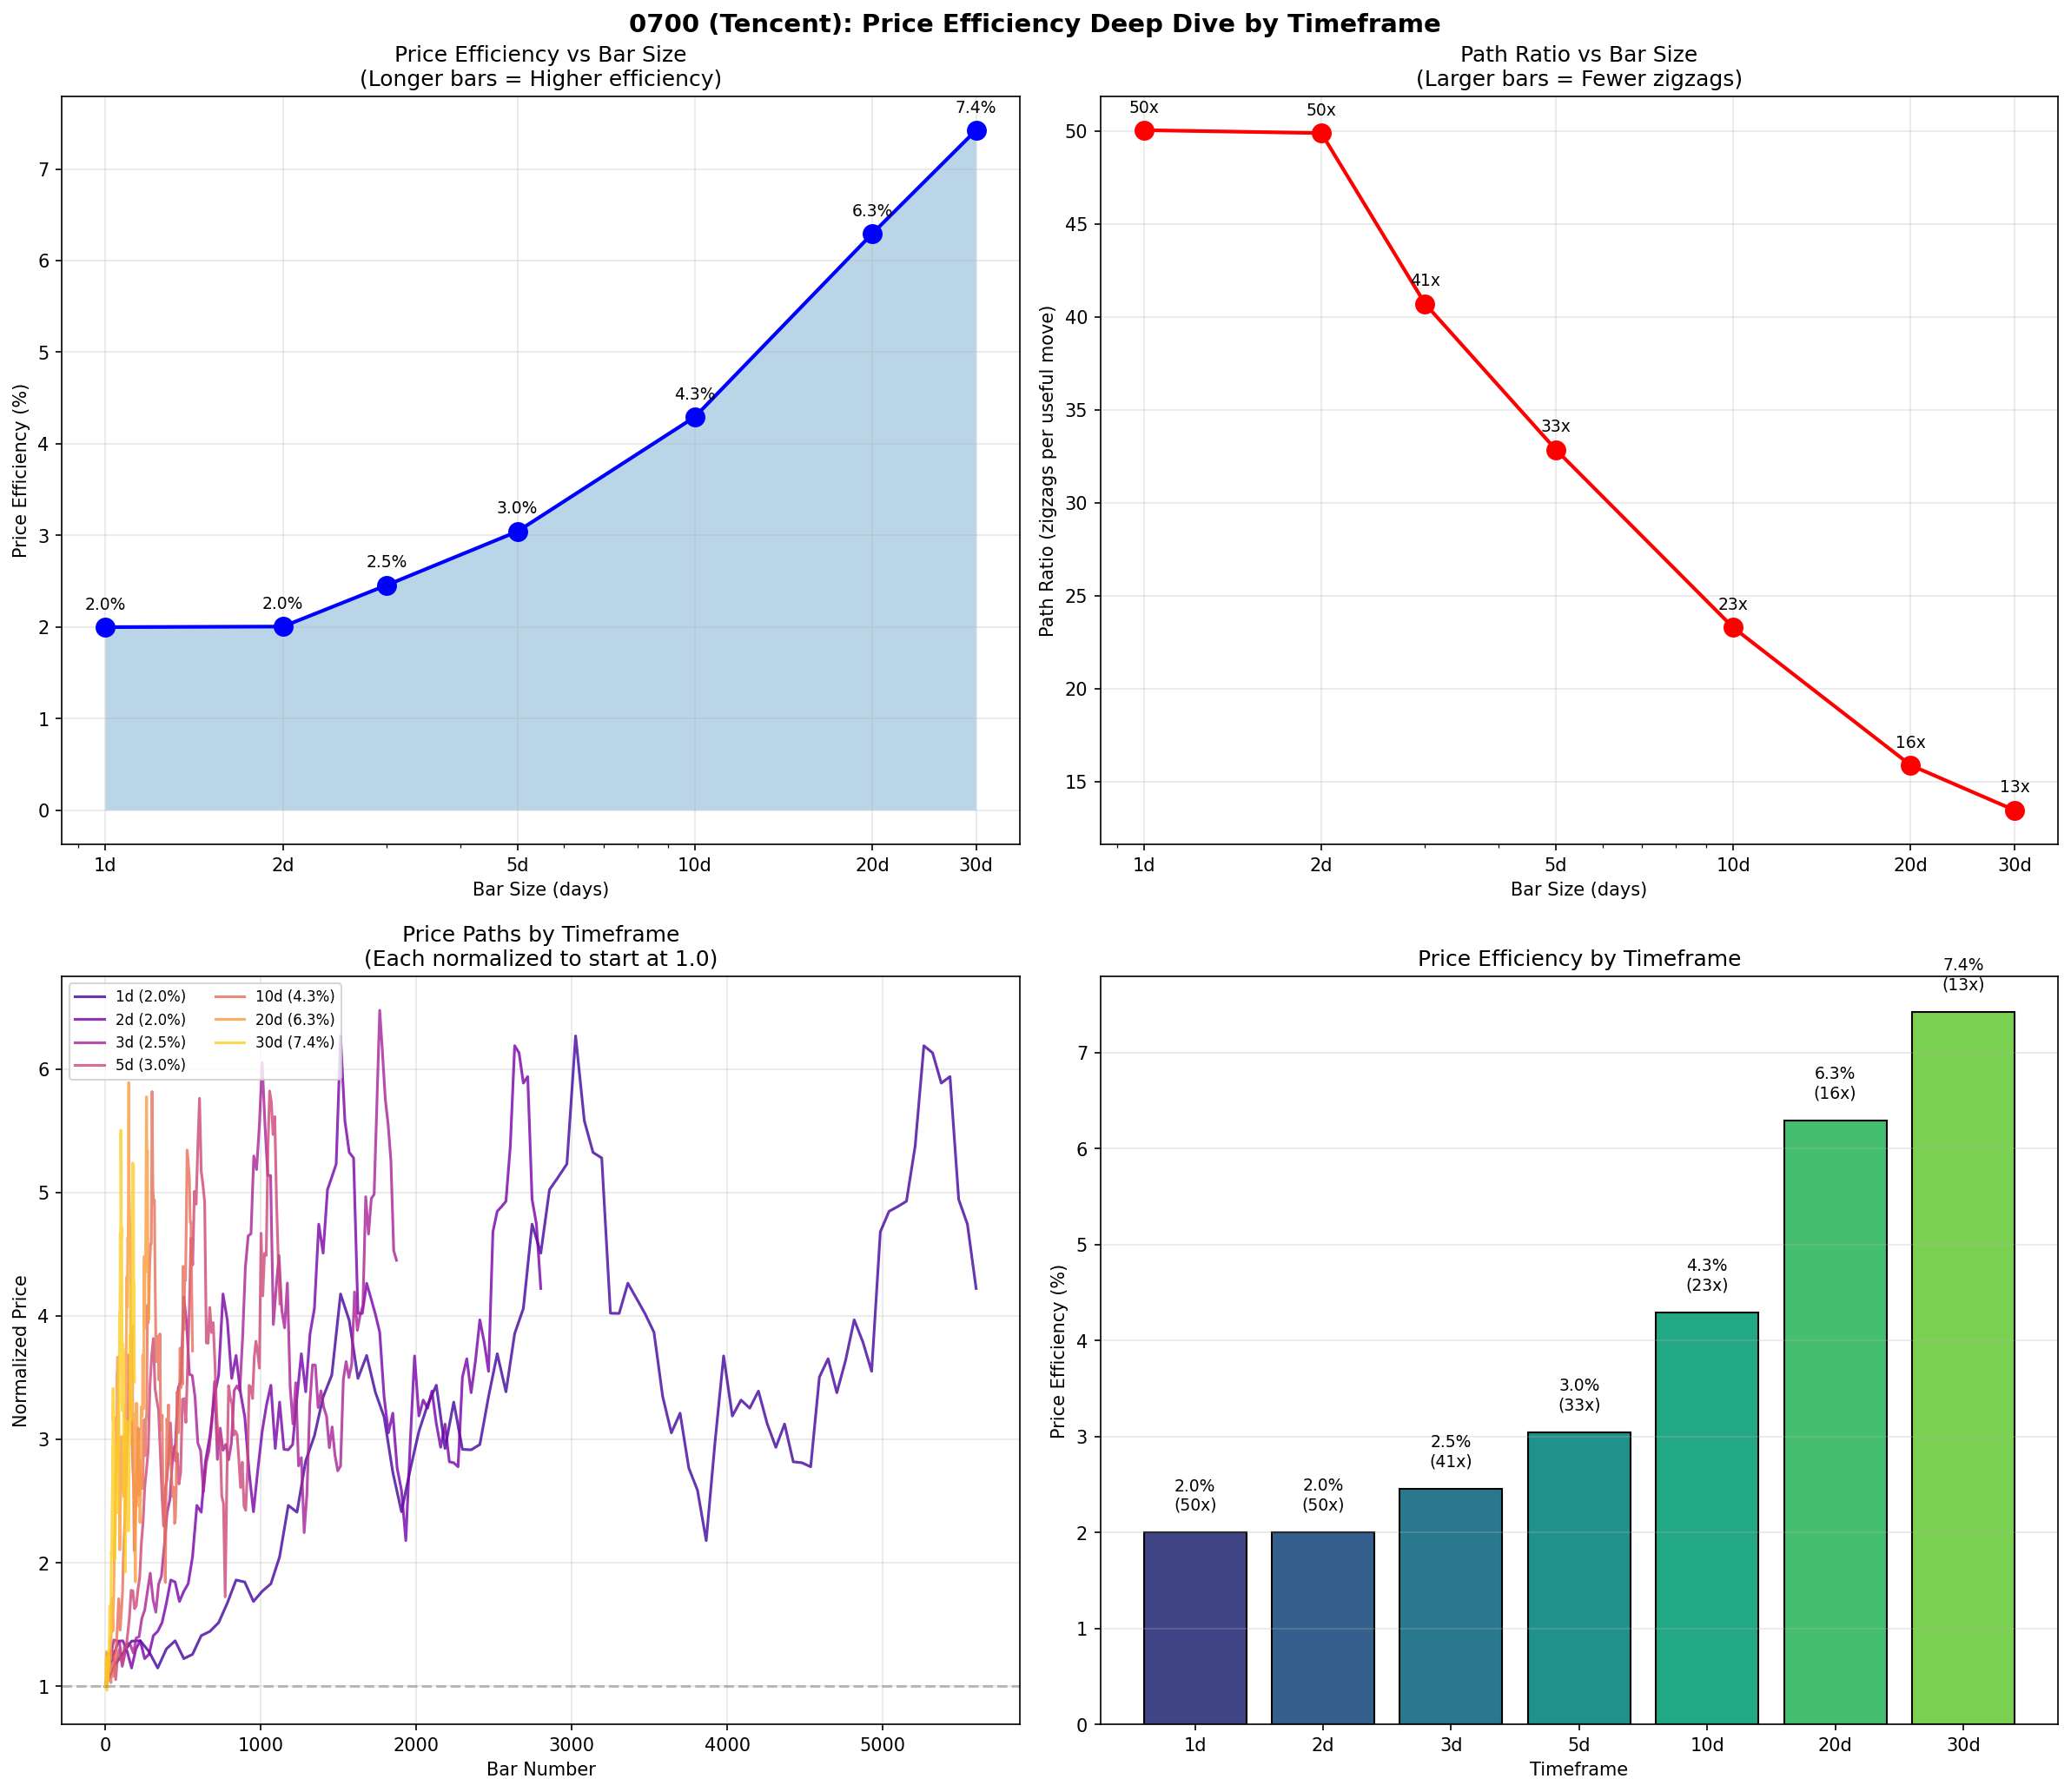
Results for Tencent (0700)
| Bar Size | Number of Bars | Price Efficiency | Path Ratio | "Wasted" Movement |
|---|---|---|---|---|
| 1 day | 5,639 | 2.0% | 50x | 98% |
| 2 days | 2,820 | 2.0% | 50x | 98% |
| 5 days | 1,128 | 3.0% | 33x | 97% |
| 10 days | 564 | 4.3% | 23x | 96% |
| 20 days | 282 | 6.3% | 16x | 94% |
🔑 Key Finding
Larger bars = Higher efficiency
When we smooth out the noise by using longer bars:
- 1-day bars: 2% efficiency (50x zigzag)
- 5-day bars: 3% efficiency (33x zigzag)
- 20-day bars: 6% efficiency (16x zigzag)
🧠 Why Does This Happen?
The Mathematics
When you increase bar size, you're combining multiple smaller moves into one larger move. Any reversals within the bar get smoothed out — only the NET change remains.
Example:
5 daily bars: +2%, -1%, +3%, -2%, +4%
Net for 5d bar: +6%
Actual path: 12% (2+1+3+2+4)
Efficiency: 6/12 = 50%
The Illusion
This means that weekly/monthly traders often appear more "skilled" than daily traders — but they're just using a smoother view of the same data!
The zigzag is still there; you just can't see it in the bars anymore.
This is NOT manipulation — it's just that longer timeframes naturally filter out noise.
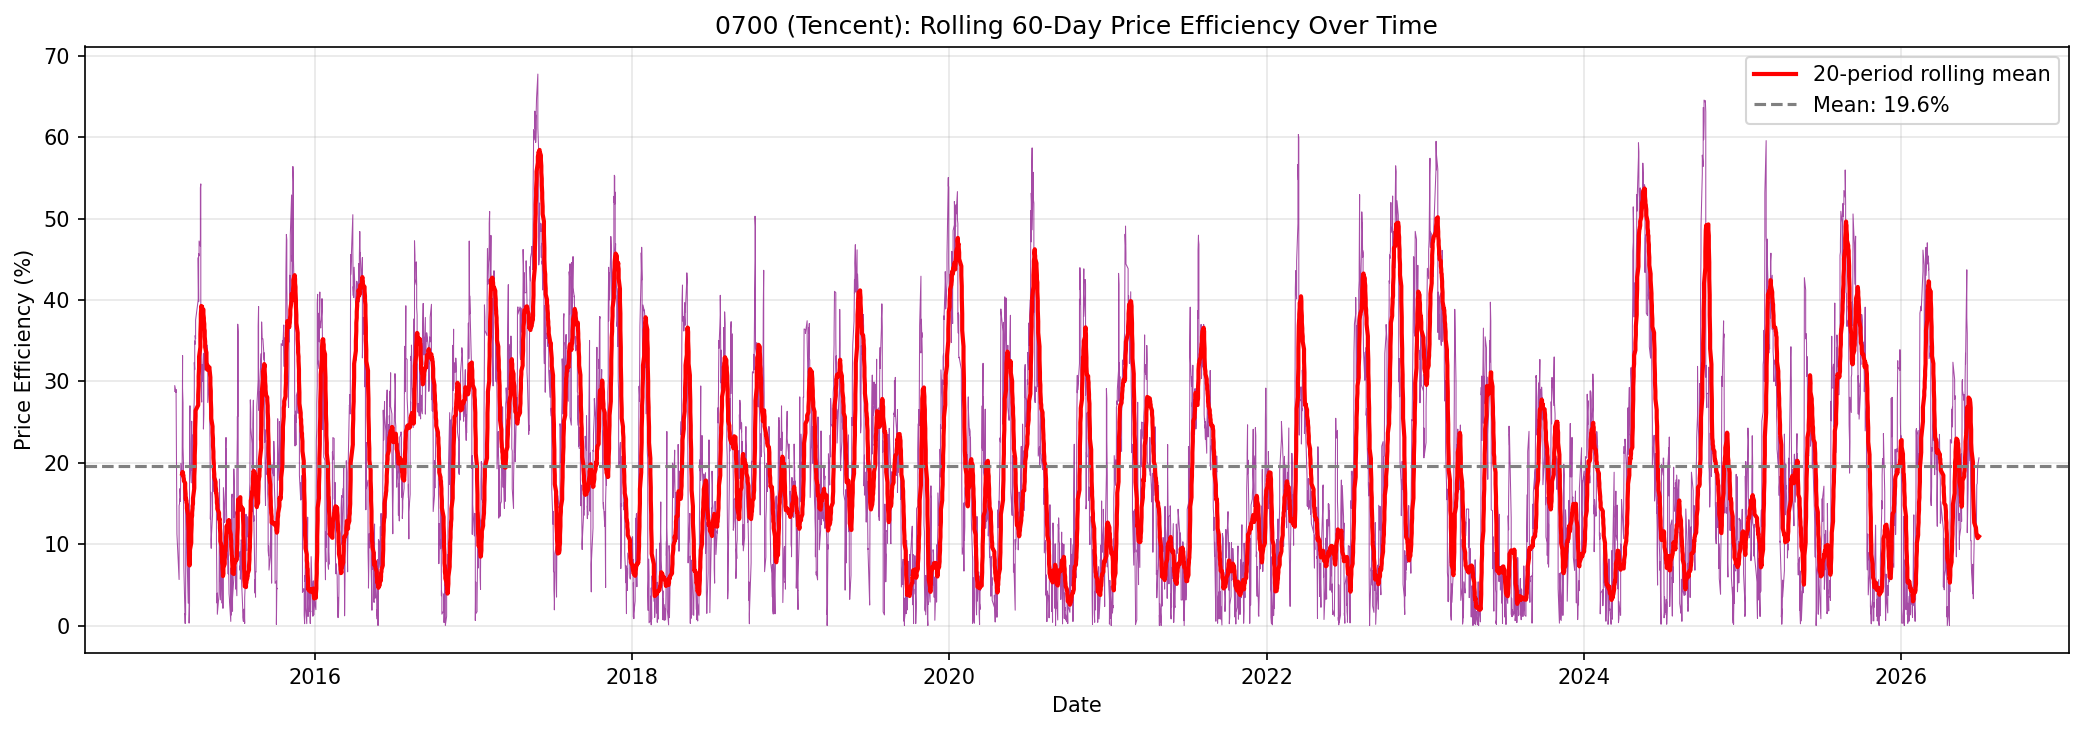
📈 Rolling Efficiency Over Time
Efficiency isn't constant — it varies dramatically over time. Let's look at a rolling 60-day efficiency for Tencent:
📊 Multi-Stock Comparison by Timeframe
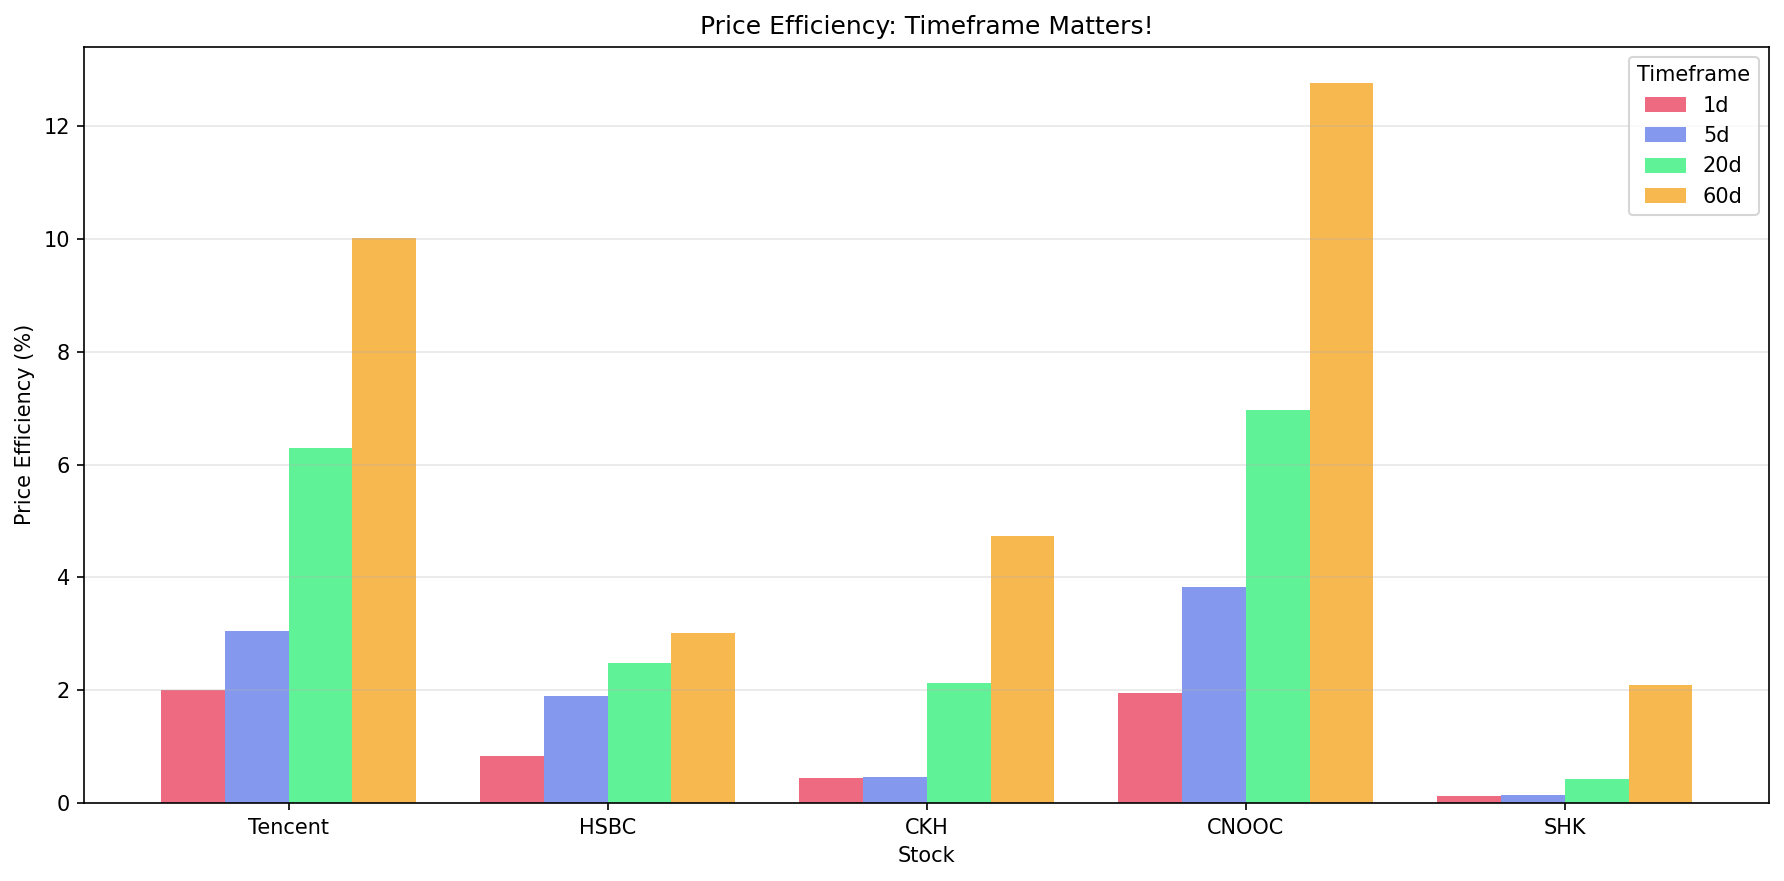
Price Efficiency by Stock and Timeframe
| Stock | 1 Day | 5 Days | 20 Days | 60 Days | Best Improvement |
|---|---|---|---|---|---|
| Tencent (0700) | 2.0% | 3.0% | 6.3% | 10.0% | 5x (1d→60d) |
| HSBC (0011) | 0.8% | 1.9% | 2.5% | 3.0% | 3.8x |
| CKH Holdings (0001) | 0.4% | 0.5% | 2.1% | 4.7% | 12x |
| CNOOC (0883) | 1.9% | 3.8% | 7.0% | 12.8% | 6.7x |
| SHK Property (0016) | 0.1% | 0.2% | 0.4% | 2.1% | 21x |
🎯 Summary: What We Learned
1. Timeframe Matters A LOT
Moving from daily to 60-day bars increases efficiency by 3-21x depending on the stock. SHK Property went from 0.1% to 2.1% — a 21x improvement just by using longer bars!
2. The "Smoothing Illusion"
Longer-timeframe traders aren't necessarily more skilled — they're just using smoothed data that naturally filters out reversals. The zigzag is still there; it's just invisible.
3. Efficiency Varies Over Time
Rolling 60-day efficiency ranges from 0% to 68%. Some periods are strongly trending (high efficiency), others are choppy (low efficiency). This could be useful for regime detection.
4. Some Stocks Are "Naturally Efficient"
CNOOC at 60 days has 12.8% efficiency — the highest in our sample. This suggests it has longer, cleaner trends. SHK Property is the worst at all timeframes — lots of reversals.
Questions for Further Research
- Can we use rolling efficiency to detect trend vs range-bound regimes?
- Does low efficiency predict mean reversion?
- What's the "optimal" bar size for each stock?
- Can we trade efficiency itself? (Buy high efficiency periods, sell low?)
Analysis using EODHD data | QuestDB | Python